
Menu
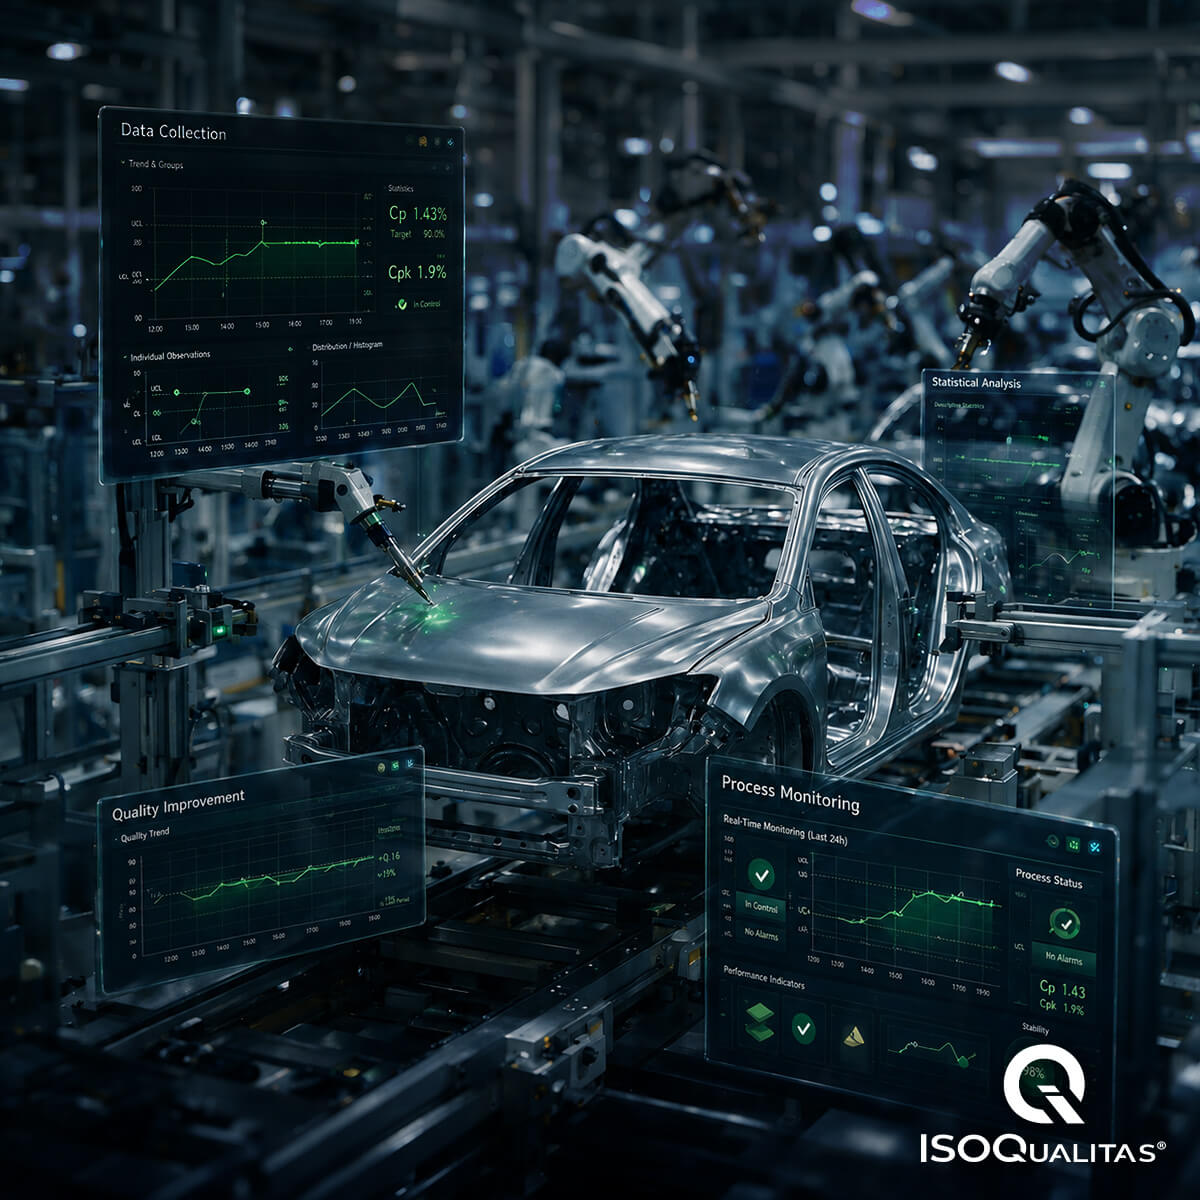
SPC in the Automotive Industry: How Statistical Process Control Reduces Variations and Increases Capability
In the automotive industry, producing parts within specification is not enough. It is mandatory to ensure that the production process is stable, repetitive, and capable over time.
Even when a product meets requirements, uncontrolled variations can indicate future problems in the process, increasing the risk of deviations, rework, and non-conformances.
In this context, SPC – Statistical Process Control, is a widely used methodology to monitor process behavior and identify trends before failures occur.
SPC is part of the continuous improvement framework used by the automotive industry and contributes directly to meeting the requirements of IATF 16949.
What is the SPC?
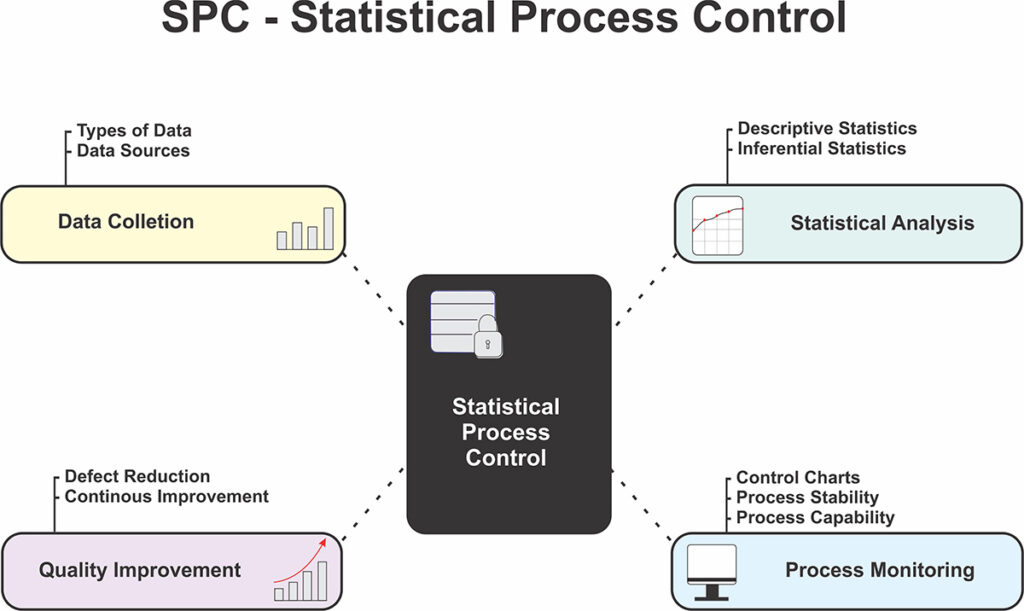
SPC – Statistical Process Control is a methodology based on the statistical analysis of the data collected during production.
Your goal is:
- Monitor process stability
- identify variations due to special causes
- reduce dispersions
- Prevent deviations before non-conformities are generated
- Supporting continuous improvement
O CEP allows us to distinguish:
Variations due to common causes
They are inherent to the process and are part of its natural variability.
Variations due to special causes
They are caused by specific factors, such as:
- Tool Wear
- Inadequate adjustments / setup
- Operational failures
- Raw material changes
- Production equipment problems
Identifying these variations allows you to act before the problem affects the product.
Main tools used in the SPC
Statistical control uses different methods to monitor the behavior of the process. Among the most used are:
Control Charts
They allow you to follow the variation of the process over time through the Control Charts.
Examples:
Control Charts by Variables
- X̄ – R (Averages > Ranges)
- X̄ – S (Averages > Standard Deviation)
- X – MR (Individuals > Moving Range)
Attributes Control Charts
- p (Proportion of Non-Conforming Items)
- np (Quantity of Non-Conforming Items)
- c (Total Quantity of Non-Conformities by Subgroups with Constant Sample Size)
- u (Number of Nonconformities per Unit)
These charts help identify deviations and instability trends during the manufacturing process.
Histograms
Allow you to visualize the distribution of data and analyze:
- Process dispersion
- concentration of measurements
- Process behavior over time
- Determination of Data Distribution (Normal, Normal Log, Exponential, etc..
Trend Analysis
Used to identify:
- process shifts
- Increased variability
- gradual changes of the manufacturing process before failures occur
- abrupt process changes of the manufacturing process
SPC and Process Capability: what is the relationship?
A common mistake is to evaluate Cp and Cpk without checking the stability of the manufacturing process.
Before performing capability studies, it is necessary to confirm that the process is under statistical control, that is, all existing variations are due only to common causes.
Only after this validation do the capability indexes present reliable results.
The SPC provides the basis for:
- Cm and CmK studies – Machine Capability (Very Short Term)
- Pp and PpK studies – Process Performance (Short Term))
- Cp and Cpk studies – Process Capability (Long Term)
- Compliance with PPAP validation requirements
- Continuous monitoring of special characteristics of critical processes
- Productive performance analysis for product compliance
This control also directly impacts processes such as PPAP in the automotive industry: how to organize and streamline product approvals with the customer, where statistical studies are used in approvals.
Integration of SPC with APQP Core Tools
The CEP should not operate in isolation.
It is connected with several tools used in automotive development:
MSA
Validates the reliability of measurement systems.
Before the CEP, it is necessary to ensure that the data obtained is reliable.
Relationship with: MSA in the automotive industry: how to validate measurement systems and avoid analysis errors
PFMEA
The risks identified in PFMEA may indicate characteristics that require statistical monitoring and are directly connected with the score of the occurrence of non-conformities (Causes of Failure Modes).
Relationship with: FMEA in the Automotive Industry: How to Structure DFMEA and PFMEA According to IATF 16949
Control Plan
Defines which characteristics will be monitored and the methods used.
PPAP
Statistical studies are part of the evidence submitted to the client.
Common challenges in SPC application
Despite being widely used, some difficulties are still frequent:
- Manual data collection
- Failure to update control limits
- incorrect interpretation of statistical charts
- use of data without prior MSA validation
- disconnection between SPC, PFMEA and Control Plan
These factors reduce the effectiveness of monitoring and can lead to incorrect decisions about the process.
How ISOQualitas PLM contributes to SPC management
ISOQualitas PLM supports the integration of technical information throughout the product lifecycle.
In the context of the SPC, the system allows:
- Integration with APQP Core Tools
- Connection between PFMEA, control plan and production processes
- Traceability of quality information
- Structured management of critical features
- Support for evidence required in IATF 16949 audits
- Integration with statistical analysis and continuous improvement processes
- In this way, statistical control is no longer just an operational activity and becomes part of the technical management of the product and the process.
The SPC is an essential tool to ensure stability, capability, and predictability in automotive production.
When integrated with the other APQP Core Tools, it contributes to reducing variations, increasing the robustness of processes and ensuring product quality.
With the support of solutions such as ISOQualitas PLM, companies are able to integrate technical information, increase traceability, and structure a more robust product lifecycle management.
Recent Posts
Archive
Categories
Categories
- APQP and Core Tools (4)
- APQP e Core Tools (2)
- Automotive Audits (2)
- Automotive Cybersecurity (1)
- Automotive Digital Transformation (1)
- Automotive Process Engineering (2)
- Automotive Quality and Compliance (1)
- Automotive Quality Management (8)
- Automotive Risk and Quality Management (1)
- Blog (2)
- Digital Transformation in Industry (6)
- Engenharia de Processos Automotivos (2)
- Engenharia de Produto e Processos (2)
- Engineering and Quality (1)
- ESG in the Automotive Sector (1)
- Future of Work (1)
- Gestão da Qualidade Automotiva (2)
- IATF 16949 (3)
- IATF 16949 Compliance (1)
- Industrial Automation (2)
- Industrial Efficiency (1)
- Industrial Technology and PLM (2)
- Industry 4.0 (2)
- Manufacturing Software Solutions (1)
- News (20)
- Nonconformity Reduction (1)
- Product and Process Engineering (4)
- Product Development and Engineering (3)
- Product Lifecycle Management (2)
- Product Lifecycle Management (PLM) (4)
- Qualidade Automotiva (2)
- Qualidade e Controle Estatístico de Processos (2)
- Quality and Compliance Management (1)
- Quality and Technology (2)
- Quality Management (4)
- Quality Management in Industry (1)
- Recall Prevention (1)
- Risk Analysis and Corrective Actions (1)
- Software-Defined Vehicles (SDVs) (1)
- Statistical Process Control and Quality (1)
- Sustainability in Industry (1)
- Technological Transformation (2)
Tags
Tags
Automotive APQP
automotive core tools
automotive cybersecurity
automotive FMEA
automotive industry 4.0
automotive nonconformities
automotive PLM
automotive ppap
automotive product engineering
automotive quality
automotive quality software
automotive risk management
automotive spc
automotive traceability
Continuous improvement in the automotive industry
corrective and preventive actions
dfmea pfmea
digital FMEA
engineering and quality integration
engineering change management
Global 8D
IATF 16949
IATF 16949 and ESG
IATF 16949 compliance
industrial digital transformation
industrial erp
Industrial performance indicators (KPIs)
industrial risk management
Industry 4.0 and quality
ISOQualitas PLM
não conformidades automotivas
pfmea
problem solving
process control
process traceability
product engineering automotive
product lifecycle management
quality KPIs
quality management system
quality management system qms
robots and workforce
root cause analysis
sistema de gestão da qualidade
top QMS automotive 2026
vehicle digital safety